PJSC Polyus (LSE, MOEX — PLZL) (“Polyus”, the “Company”, and together with the Company subsidiaries, the “Group”) has today released its consolidated financial results for the second quarter and first half of 2018.
Key highlights
- Gold sales: the company sold a total of 531 thousand ounces of gold in the second quarter of 2018, up 16% compared to the first quarter. Gold output (refined and concentrate) increased 19% compared to the previous quarter, reflecting higher production volumes at Olimpiada, Blagodatnoye and the start of the washing season at Alluvials.
- Total gold sales include 31 thousand ounces of gold contained in flotation concentrate from Olimpiada.
- Revenue totalled $692 million in the second quarter of 2018, a 12% increase compared to $617 million in the first quarter, driven by higher sales volumes (including flotation concentrate).
- Group TCC decreased 10% in the second quarter of 2018, to $345 per ounce compared to $383 per ounce in the first quarter, mainly due to the local currency depreciation. The group has launched high-grade antimony-rich ore processing earlier this year with the first shipments to foreign offtakers made in May 2018. TCC for the second quarter of 2018 reflects a by-product credit in the amount of $8 per ounce. At the same time, AISC decreased to $601 per ounce, down 12% compared to the first quarter of 2018.
- Adjusted EBITDA amounted to $457 million in the second quarter of 2018, an 18% increase from the first quarter of 2018, driven by higher gold sales volumes and lower TCC on a per ounce basis. Adjusted EBITDA margin reached 66% in the second quarter of 2018.
- Profit for the second quarter of 2018 decreased to $114 million, mainly reflecting an impact of non-cash items, such as a foreign exchange loss and a revaluation of derivative financial instruments in the period.
- Adjusted net profit for the second quarter of 2018 increased more than two times on the previous quarter and amounted to $457 million.
- Net cash inflow from operations amounted to $376 million in the second quarter of 2018, compared to $261 million in the first quarter.
- Capex increased to $219 million in the second quarter of 2018, up 20% compared to the previous quarter, reflecting higher capital expenditures at Olimpiada, Blagodatnoye and Kuranakh, while capex at Natalka decreased to $64 million.
- Cash and cash equivalents as at 30 June 2018 amounted to $908 million, compared to $1,095 million as at 31 March 2018, following dividend payments for the second half 2017 in the amount of $293 million with the remaining $18 million due in the third quarter of 2018.
- Net debt increased to $3,208 million at the end of the second quarter of 2018 compared to $3,079 million as at the end of the first quarter.
Pavel Grachev, Chief Executive Officer of PJSC Polyus, commented
Polyus has had a strong second quarter. We have delivered double-digit growth in revenue and EBITDA.
Our total cash costs remain safely below $425/oz, in line with Polyus guidance for 2018. The launch of the recently announced antimony project facilitated further improvement on the cost side.
The ramp-up of production at Natalka is in its final stage, and we expect to see this asset reaching full design capacity in the coming months.
Strong operational performance and good progress on our development projects at core operations give us confidence in achieving our full year production guidance of 2,375—2.425 million ounces of gold
Comparative financial results
|
$ million (if not mentioned otherwise) |
2Q 2018 |
1Q 2018 |
Q-o-Q |
2Q 2017 |
Y-o-Y |
1H 2018 |
1H 2017 |
Y-o-Y | |
|---|---|---|---|---|---|---|---|---|---|
| Operating highlights | |||||||||
| Gold production (koz) 1 | 602 | 507 | (19%) | 488 | 23% | 1 109 | 938 | 18% | |
| Gold sold (koz) | 531 | 459 | 16% | 496 | 7% | 990 | 983 | 1% | |
| Realised prices | Average realised refined gold price (excluding effect of SPPP) ($/oz) 2 | 1, 300 | 1, 336 | (3%) | 1, 261 | 3% | 1, 317 | 1, 239 | 6% |
| Average realised refined gold price (including effect of SPPP) ($/oz) | 1, 300 | 1, 336 | (3%) | 1, 268 | 3% | 1 317 | 1, 263 | 4% | |
| Financial performance | |||||||||
| Total revenue | 692 | 617 | 12% | 625 | 11% | 1, 309 | 1, 234 | 6% | |
| Operating profit | 385 | 332 | 16% | 324 | 18% | 717 | 654 | 10% | |
| Operating profit margin | 56% | 54% | 2 ppts | 52% | 3 ppts | 55% | 53% | 2 ppts. | |
| Profit for the period | 114 | 244 | (53%) | 104 | (10%) | 358 | 603 | (41%) | |
| Earnings per share — basic (US Dollar) | 0.83 | 1.87 | (56%) | 0.84 | (1%) | 2.70 | 4.85 | (44%) | |
| Earnings per share – diluted (US Dollar) | 0.74 | 1.80 | (59%) | 0.83 | (11%) | 2.54 | 4.84 | (48%) | |
| Adjusted net profit 3 | 457 | 223 | 105% | 272 | 68% | 680 | 475 | 43% | |
| Adjusted net profit margin | 66% | 36% | 30 ppts | 44% | 12 ppts | 52% | 38% | 14 ppts | |
| Adjusted EBITDA4 | 457 | 387 | 18% | 379 | 21% | 844 | 762 | 11% | |
| Adjusted EBITDA margin | 66% | 63% | 3 ppts | 61% | 5 ppts | 64% | 62% | 2 ppts | |
| Net cash flow from operations | 376 | 261 | 44% | 268 | 40% | 637 | 550 | 16% | |
| Capital expenditure5 | 219 | 182 | 20% | 190 | 15% | 401 | 320 | 25% | |
| Cash costs | |||||||||
| Total cash cost (TCC) per ounce sold6 | 345 | 383 | (10%) | 379 | (9%) | 363 | 379 | (4%) | |
| All-in sustaining cash cost (AISC) per ounce sold 7 | 601 | 684 | (12%) | 634 | (5%) | 639 | 610 | 5% | |
| Financial position | |||||||||
| Cash and cash equivalents | 908 | 1, 095 | (17%) | 1, 477 | (39%) | 908 | 1, 477 | (39%) | |
| Net debt8 | 3, 208 | 3, 079 | 4% | 3, 084 | 4% | 3, 208 | 3, 084 | 4% | |
| Net debt/adjusted EBITDA 9 | 1.8 | 1.8 | 0% | 1.9 | (5%) | 1.8 | 1.9 | (5%) |
Total Cash Costs
In the second quarter of 2018, group TCC decreased 10% to $345 per ounce compared to the previous quarter, mainly due to the local currency depreciation by 9% and a by-product credit from sales of antimony-rich flotation concentrate. The group has launched high-grade antimony-rich ore processing, with the first volumes of antimony concentrate produced in the first quarter. In April 2018, Polyus obtained a licence permitting the group to export antimony-rich flotation concentrate to offtakers abroad and started first shipments in May. The revenue from sale of antimony is recognised as a decrease to cost of gold sales upon its delivery to customers and amounted to $8 per ounce in the second quarter.
TCC performance by mine, $/oz
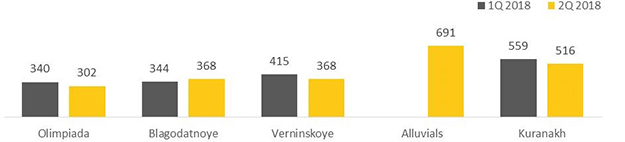
In the second quarter of 2018, TCC at Olimpiada decreased to $302 per ounce, down 11% compared to the first quarter, resulting from the local currency depreciation, higher gold and flotation concentrate sales volumes and by-product credit from sales of antimony-rich flotation concentrate in the amount of $8 per ounce. These factors were partially offset by an increased consumption of reagents (sodium cyanide), as well as increase in labour expenses due to annual salary indexation and inflation in fuel prices.
At Blagodatnoye, TCC amounted to $368 per ounce, up 7% compared to the first quarter of 2018, due to a decline in the average grade in ore processed (1,6 grams per tonne in the second quarter of 2018 compared to 1,7 grams per tonne in the first quarter). Polyus continues mining activities at low-grade flank areas of the Blagodatnoye deposit during a pit cutback. In addition, an increase in labour expenses and inflation in fuel prices put further pressure on costs, while the local currency depreciation and lower maintenance expenses in the period partly offset these negative factors.
TCC at Verninskoye decreased to $368 per ounce, down 11% compared to the first quarter of 2018, mainly due to the local currency depreciation in the period and lower maintenance expenses, which fully offset higher labour costs during the reporting period.
At Kuranakh, TCC decreased to $516 per ounce, down 8% compared to the first quarter of 2018 mainly due to the local currency depreciation. An increase in labour expenses and growth in maintenance expenses were offset by a positive dynamic in average grade in ore processed (1,3 grams per tonne in the second quarter of 2018 compared to 1,2 grams per tonne in the first quarter) and lower power expenses.
TCC at Alluvials stood at $691 per ounce, reflecting the start of the washing season in April 2018.
All-in sustaining costs (AISC)
In the second quarter of 2018, the group’s AISC decreased to $601 per ounce, down 12% compared to the first quarter, trending in line with TCC per ounce.
All-in sustaining costs by mine, $/oz
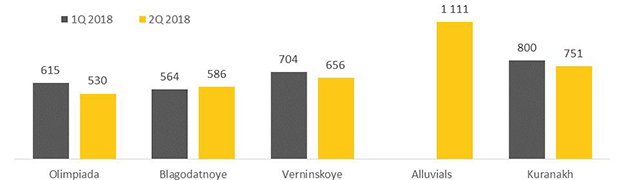
AISC at Olimpiada decreased to $530 per ounce driven by lower sustaining capital expenditures. At Blagodatnoye, AISC increased to $586 per ounce on higher stripping expenses due to the ongoing pit cutback. AISC at Verninskoye decreased to $656 per ounce, while AISC at Kuranakh decreased to $751 per ounce both driven by lower sustaining capital expenditures.
Capex
In the second quarter of 2018, capital expenditures increased to $219 million, from $182 million in the first quarter.
Capital expenditures at Natalka, the group’s main development project, decreased by 22% in the second quarter of 2018, to $64 million. Purchase of equipment during the period amounted to $46 million, compared to $45 million in the first quarter.
In the reporting period, the group continued to capitalise borrowing costs and other directly attributable operating costs related to development of Natalka. In particular, total capitalised costs amounted to $32 million, including $24 million in borrowing costs and $8 million in operating cost net of revenue.
The construction works at the Natalka Mill’s auxiliary and infrastructure facilities are in progress. This includes earthworks and site preparation works at the main tailings storage facility and fuel warehouse.
Natalka is currently operating at above 90% of its design capacity of 10 million tons on an annualised basis. Mining fleet procurement is ongoing with nine dump trucks delivered on site in the reporting period.
Capital expenditures at Olimpiada increased nearly two times to $64 million in the second quarter of 2018. This was mainly driven by supply of two excavators WK-35 as well as two drilling rigs Atlas Copco SmartRoc. Moreover, there was delivery of four flash-flotation machines SkimAir and a steam boiler under the Olimpiada mill complex expansion project in order to increase recovery rate.
At Blagodatnoye, capital expenditures increased to $34 million in the second quarter of 2018. There was a delivery of seven CAT 220t dump trucks, as part of the program of Blagodatnoye open pit expansion, as well as flash-flotation machine SkimAir to stabilise recovery. In addition, construction and design works started for the tailings storage facility of the Blagodatnoye mill expansion project.
At Verninskoye, capital expenditures amounted to $9 million in the second quarter of 2018. This included capitalised repairs, construction of social facilities and exploration activity.
Capital expenditures at Kuranakh increased to $14 million in the second quarter of 2018 due to procurement of processing equipment for the Mill expansion project. In addition, seasonal ore stacking and spraying under the Heap Leaching project started.
At Alluvials, capital expenditures amounted to $8 million in the second quarter of 2018 and related to exploration activity as well as the ongoing replacement of worn-out equipment.
At Sukhoi Log, the verification drilling program of 43 thousand meters was completed. The logging and interpretation of the verification drilling results are now being finalized. AMC has been engaged to supervise the drilling program and review the results in compliance with JORC standards. The scoping study is completed by Hatch and has outlined key directions of further geological, engineering and infrastructure development. With the scoping study completed, Sukhoi Log is now entering the pre-feasibility stage.
Capex breakdown10
| $ million |
2Q 2018 |
1Q 2018 |
Q-o-Q |
1H 2018 |
1H 2017 |
Y-o-Y |
|---|---|---|---|---|---|---|
| Natalka, including | ||||||
| Purchase of equipment | 46 | 45 | 2% | 91 | 105 | (13%) |
| Capitalisation of borrowing costs | 24 | 23 | 4% | 47 | 46 | 2% |
| Operating costs | 8 | 17 | (53%) | 25 | 26 | (4%) |
| Net proceeds from selling gold produced during the ramp-up period | (14) | (3) | N.A. | (17) | - | N.A. |
| Natalka, total | 64 | 82 | (22%) | 146 | 177 | (18%) |
| Olimpiada | 64 | 36 | 78% | 100 | 52 | 92% |
| Blagodatnoe | 34 | 17 | 100% | 51 | 13 | N.A. |
| Verninskoye | 9 | 10 | (10%) | 19 | 12 | 58% |
| Alluvials | 8 | 6 | (33%) | 14 | 12 | 17% |
| Kuranakh | 14 | 9 | 56% | 23 | 22 | 5% |
| Other 11 | 26 | 22 | 18% | 48 | 32 | 50% |
| Capex | 219 | 182 | 20% | 401 | 320 | 25% |
| Omchak electricity transmitting line | 8 | 9 | (11%) | 17 | - | N.A. |
| Items capitalised12, net | 10 | 5 | 100% | 15 | 2 | N.A. |
| Change in working capital for purchase property, plant and equipment | (22) | 4 | N.A. | (18) | (35) | (49%) |
| Purchase of PP&E13 | 215 | 200 | (8%) | 415 | 287 | 45% |
Conference call
A conference call for investors and analysts hosted by Pavel Grachev (Chief Executive Officer) and Mikhail Stiskin (Senior Vice President, Finance and Strategy) will be held on 3 August 2018 at 12.00 (London) / 14.00 (Moscow).
To join the conference call, please dial:
Conference ID: 4176024
UK
+ 44 (0)330 336 9411 (Local access)
0800 279 7204 (Toll free)
USA
+ 1 929—477-0324 (Local access)
800—458-4148 (Toll free)
Russia
+ 7 495 646 9190 (Local access)
8 10 8002 8675011 (Toll free)
To access the replay, please dial:
Passcode: 4176024
UK
+ 44 (0) 207 660 0134 (Local access)
0 808 101 1153 (Toll free)
USA
+ 1 719—457-0820 (Local access)
888—203-1112 (Toll free)
Russia
810 800 2702 1012 (Toll free)
Polyus
Polyus is the largest gold producer in Russia and one of the top ten gold miners globally with the lowest cost position. Based on its 2017 Ore Reserves and Mineral Resources, Polyus group ranks second both by attributable gold reserves and gold resources among the world’s largest gold mining companies.
The Polyus group’s principal operations are located in Krasnoyarsk, Irkutsk and Magadan regions and the Republic of Sakha (Yakutia).
Enquiries:
Investor contact
Victor Drozdov, Director Investor Relations
+7 (495) 641 33 77
drozdovvi@polyus.com
Media contact
Victoria Vasilyeva, Director Public Relations
+7 (495) 641 33 77
vasilevavs@polyus.com
Forward looking statements
This announcement may contain «forward-looking statements» concerning Polyus and/or Polyus group. Generally, the words “will”, “may”, “should”, “could”, “would”, “can”, “continue”, “opportunity”, “believes”, “expects”, “intends”, “anticipates”, “estimates” or similar expressions identify forward-looking statements. The forward-looking statements involve risks and uncertainties that could cause actual results to differ materially from those expressed in the forward-looking statements. Forward-looking statements include statements relating to future capital expenditures and business and management strategies and the expansion and growth of Polyus’ and/or Polyus group’s operations. Many of these risks and uncertainties relate to factors that are beyond Polyus’ and/or Polyus group’s ability to control or estimate precisely and therefore undue reliance should not be placed on such statements which speak only as at the date of this announcement. Polyus and/or any Polyus group company assumes no obligation in respect of, and does not intend to update, these forward-looking statements, except as required pursuant to applicable law.
1 Gold production is comprised of 539 thousand ounces of refined gold and 63 thousand ounces of gold in flotation concentrate in the second quarter of 2018 and 432 thousand ounces of refined gold and 75 thousand ounces of gold in flotation concentrate in the first quarter of 2018 respectively.
2 The Strategic Price Protection Programme comprises a series of zero-cost Asian gold collars (“revenue stabiliser”)
3 Adjusted net profit is defined by the group as net profit / (loss) for the period adjusted for impairment loss / (reversal of impairment), unrealised (gain) / loss on derivative financial instruments and investments, net, foreign exchange (gain) / loss, net, and associated deferred income tax related to such items.
4 Adjusted EBITDA is defined by the group as profit for the period before income tax, depreciation and amortisation, (gain) / loss on derivative financial instruments and investments (including the effect of the disposal of a subsidiary and subsequent accounting at equity method), finance costs, net, interest income, foreign exchange gain, net, impairment loss / (reversal of impairment), (gain) / loss on property, plant and equipment disposal, expenses associated with an equity-settled share-based payment plan and special charitable contributions as required to ensure calculation of the Adjusted EBITDA is comparable with the prior period. The group has made these adjustments in calculating Adjusted EBITDA to provide a clearer view of the performance of its underlying business operations and to generate a metric that it believes will give greater comparability over time with peers in its industry. The Group believes that Adjusted EBITDA is a meaningful indicator of its profitability and performance. This measure should not be considered as an alternative to profit for the period and operating cash flows based on IFRS, and should not necessarily be construed as a comprehensive indicator of the Group’s measure of profitability or liquidity. The group calculates Adjusted EBITDA margin as Adjusted EBITDA divided by total revenue.
5 Capital expenditure figures are presented on an accrual basis (here presented net of the Sukhoi Log deposit license acquisition cost) and net of Omchak power grid construction cost.
6 TCC is defined by the group as the cost of gold sales, less property, plant and equipment depreciation and amortisation, provision for annual vacation payment, employee benefits obligation cost and change in allowance for obsolescence of inventory and adjusted by inventories. TCC per ounce sold is the cost of producing an ounce of gold, which includes mining, processing and refining costs. The group calculates TCC per ounce sold as TCC divided by total ounces of gold sold for the period. The group calculates TCC and TCC per ounce sold for certain mines on the same basis, using corresponding mine-level financial information. The group’s TCC reflects a by-product credit from sales of antimony-rich flotation concentrate, starting from the second quarter of 2018.
7 AISC is defined by the group as TCC plus selling, general and administrative expenses, stripping activity asset additions, sustaining capital expenditures, unwinding of discounts on decommissioning liabilities, provision for annual vacation payment, employee benefit obligations cost, and change in allowance for obsolescence of inventory less amortisation and depreciation included in selling, general and administrative expenses. AISC is an extension of TCC and incorporates costs related to sustaining production and additional costs which reflect the varying costs of producing gold over the life-cycle of a mine. The group believes AISC is helpful in understanding the economics of gold mining. AISC per ounce sold is the cost of producing and selling an ounce of gold, including mining, processing, transportation and refining costs, general costs from both mine and alluvial operations, and the additional expenditures noted in the definition of AISC. The group calculates AISC per ounce sold as AISC divided by total ounces of gold sold for the period.
8 Net debt is defined as non-current borrowings plus current borrowings less cash and cash equivalents and bank deposits.Net debt excludes derivative financial instrument assets/liabilities, site restoration and environmental obligations, deferred tax, deferred revenue, deferred consideration for the Sukhoi Log licence and other non-current liabilities. Net debt should not be considered as an alternative to current and non-current borrowings, and should not necessarily be construed as a comprehensive indicator of the group’s overall liquidity.
9 The group calculates net debt to Adjusted EBITDA as net debt divided by Adjusted EBITDA.
10 The capex above presents the capital construction-in-progress unit as allocated to other business units, whilst in the condensed consolidated interim financial statements capital construction-in-progress is presented as a separate business unit.
11 Reflects expenses related to exploration business unit, Peleduy-Mamakan grid lines, Sukhoi Log expenses, net of the deposit license acquisition cost and payments to RT and sales proceeds from Razdolinskaya-Taiga.
12 Including capitalised stripping costs net of capitalised interest on loans and capitalised within capital construction-in-progress. For more details see Note 11 of the condensed consolidated interim financial statements.
13 Presented net of the Sukhoi Log deposit license acquisition cost and payments to RT